

Trade Syndication · Session opens · Tuesday, Oct 13
Gold: 2.2× its opening range after the Tokyo open
The range set by 20:00 ET, the break at 22:40 ET, and how far it ran.
At each session open (Tokyo) we take a market’s first 30 minutes as its opening range, then look for the first 5-minute candle that closes outside it. These are the markets that broke out on Tuesday, Oct 13, ranked by how far they ran in the two hours after, measured against the size of the range itself. Opens follow the local clock (Tokyo 09:00, London 08:00, New York 09:30); times are New York time.
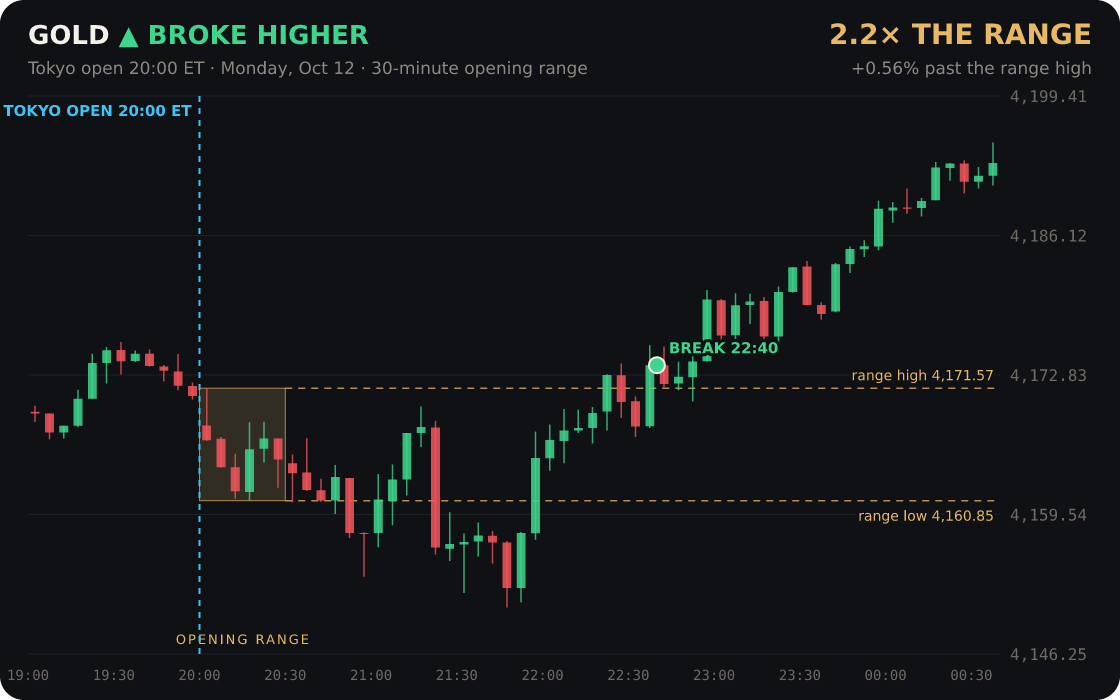
- ▲ Gold Tokyo open: broke higher at 22:40 ET, +0.56% (2.2× the range)
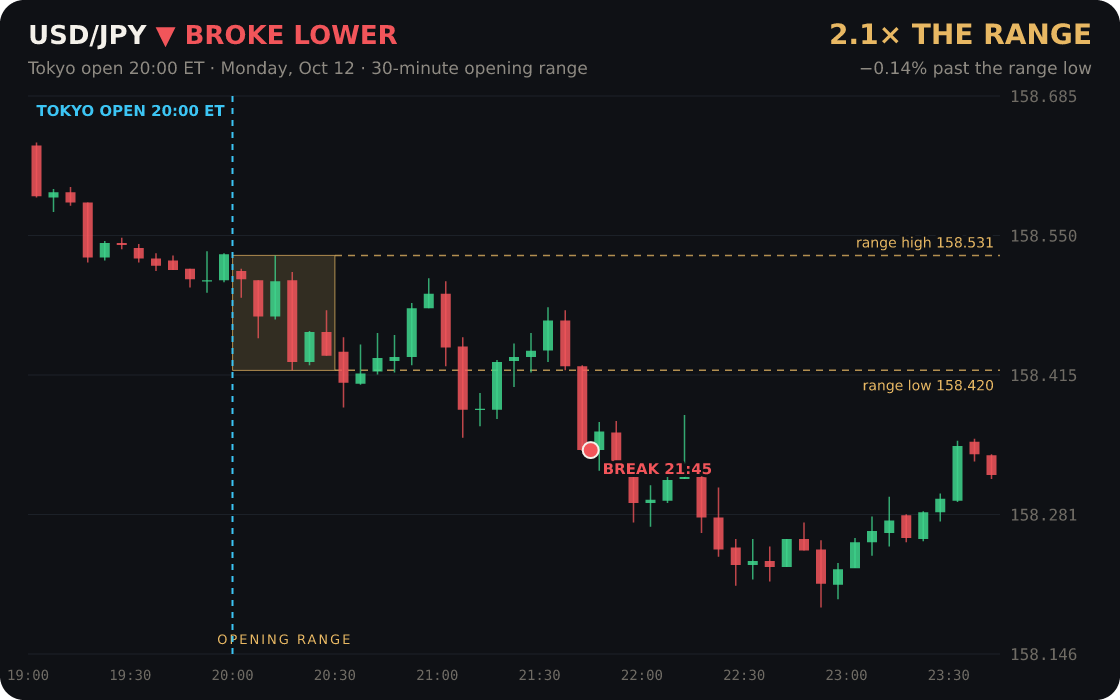
- ▼ USD/JPY Tokyo open: broke lower at 21:45 ET, −0.14% (2.1× the range)
1. Gold broke above its Tokyo opening range at 22:40 ET and ran 2.2× the range (+0.56%)
| Opening range | 0.26% (Tokyo 20:00 ET, first 30 min) |
|---|---|
| The break | 22:40 ET (a 5-minute close above) |
| Past the range | +0.56% (2.2× the range) |
Tokyo opened at 20:00 ET. In the first 30 minutes Gold traded a normal 0.26% range (4,160.85 to 4,171.57), 1.1× its usual opening range.
After a false start lower at 20:55 ET, at 22:40 ET a 5-minute candle closed above the range, and over the next two hours Gold ran as far as +0.56% past it, 2.2× the range itself.
Two hours after the break it stood +0.51% from the range high.
2. USD/JPY broke below its Tokyo opening range at 21:45 ET and ran 2.1× the range (−0.14%)
| Opening range | 0.07% (Tokyo 20:00 ET, first 30 min) |
|---|---|
| The break | 21:45 ET (a 5-minute close below) |
| Past the range | −0.14% (2.1× the range) |
Tokyo opened at 20:00 ET. In the first 30 minutes USD/JPY traded a tight 0.07% range (158.420 to 158.531), 0.7× its usual opening range.
After a false start lower at 20:35 ET, at 21:45 ET a 5-minute candle closed below the range, and over the next two hours USD/JPY ran as far as −0.14% past it, 2.1× the range itself.
Two hours after the break it stood −0.06% from the range low.
You take the trade. The desk puts its own capital behind it, steps up as it proves itself, and pays you 90% of what that capital makes.
Trade the next move with the desk behind you →
Prices are from our market data feed; times are New York time (ET), and a day runs New York 17:00 to 17:00. This is market information, not investment advice or a recommendation to trade. Past moves do not predict future ones, and trading involves risk of loss. Economic releases, forecasts and actual figures are from the Forex Factory calendar.