

Trade Syndication · Biggest movers · Thursday, Nov 5
Market movers, Nov 5: S&P 500, Nikkei 225, Nasdaq 100, Dow 30 and Ethereum
Ranked by how unusual each move was, not by its raw size.
Every market is measured against its own normal day — the average daily range of its previous 20 sessions — so a quiet currency pair moving 1% counts as much as a cryptocurrency moving 4%. These are the ones that went furthest past normal on Thursday, Nov 5.
- ▼ S&P 500 −4.94% (4.1× normal)
- ▼ Nikkei 225 −9.50% (3.5× normal)
- ▼ Nasdaq 100 −6.95% (3.1× normal)
- ▼ Dow 30 −4.06% (3.1× normal)
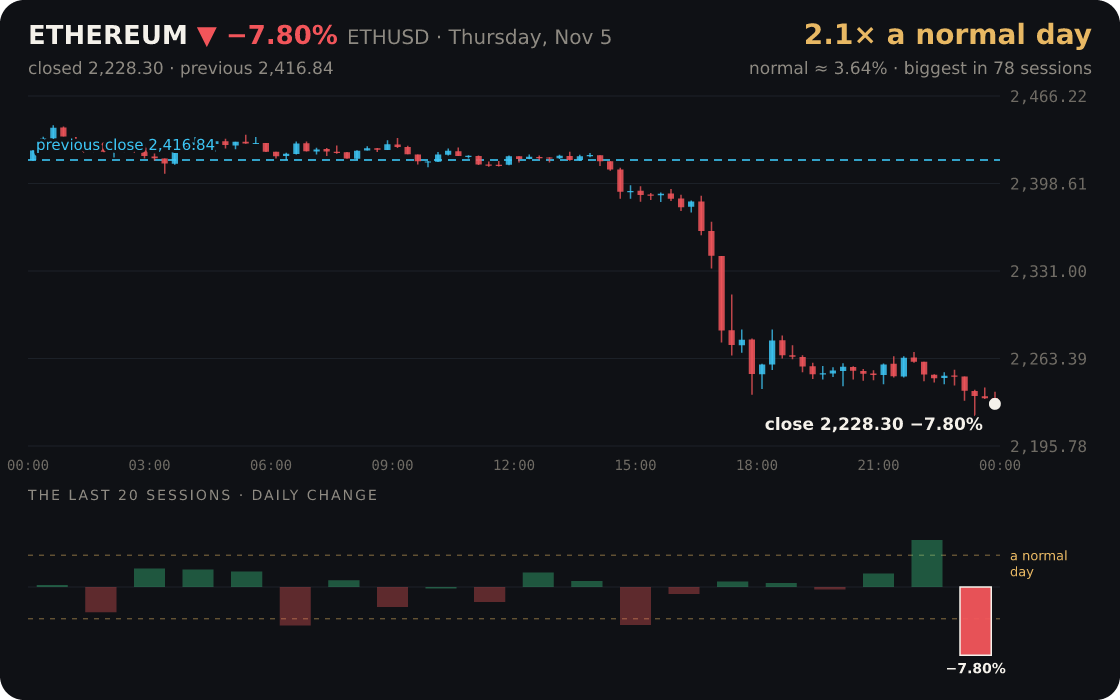
- ▼ Ethereum −7.80% (2.1× normal)
1. S&P 500 fell 4.94% — 4.1× a normal day
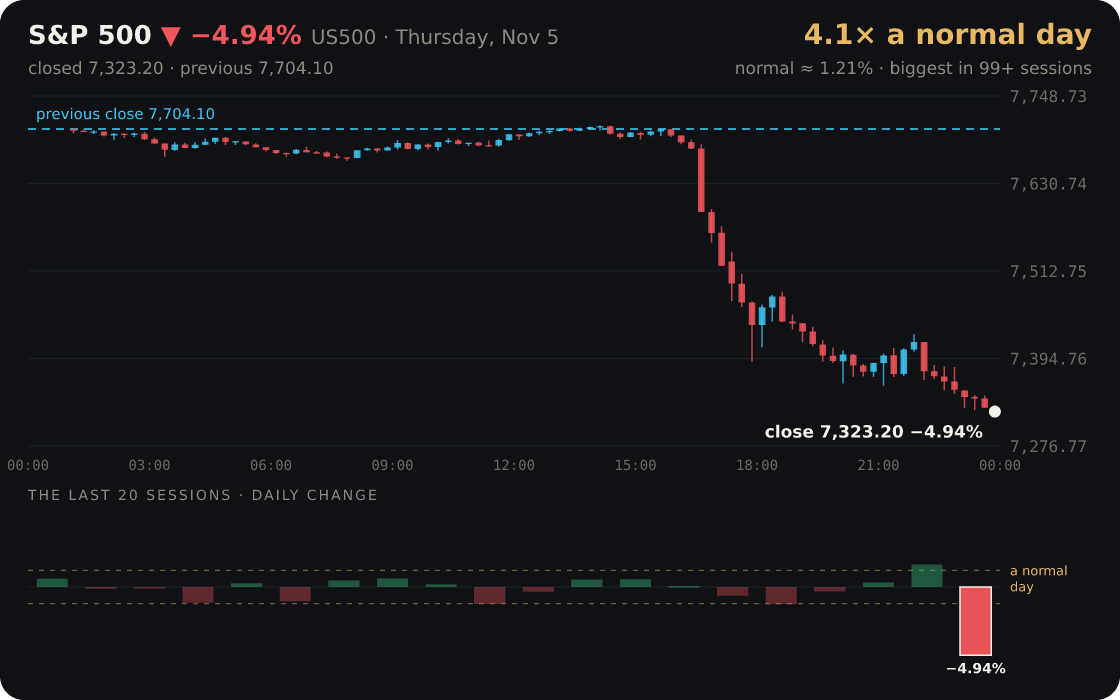
| The move | −4.94% (close to close) |
|---|---|
| A normal day | 1.21% (20-day average range) |
| This day | 4.1× (a normal day) |
S&P 500 fell 4.94% on Thursday, its largest one-day move in at least 99 sessions.
A normal day for S&P 500 is about 1.21%; this one was 4.1× that.
It opened at 7,703.90, traded between 7,316.10 and 7,709.40, and closed at 7,323.20.
2. Nikkei 225 fell 9.50% — 3.5× a normal day
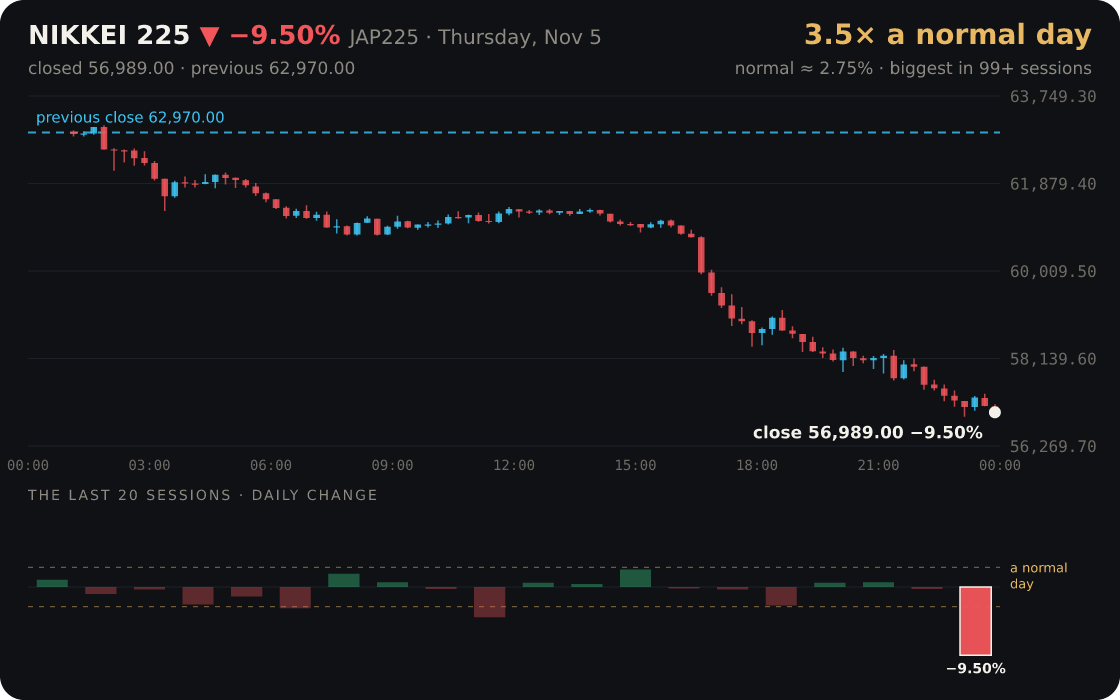
| The move | −9.50% (close to close) |
|---|---|
| A normal day | 2.75% (20-day average range) |
| This day | 3.5× (a normal day) |
Nikkei 225 fell 9.50% on Thursday, its largest one-day move in at least 99 sessions.
A normal day for Nikkei 225 is about 2.75%; this one was 3.5× that.
It opened at 62,977.00, traded between 56,893.00 and 63,126.00, and closed at 56,989.00.
3. Nasdaq 100 fell 6.95% — 3.1× a normal day
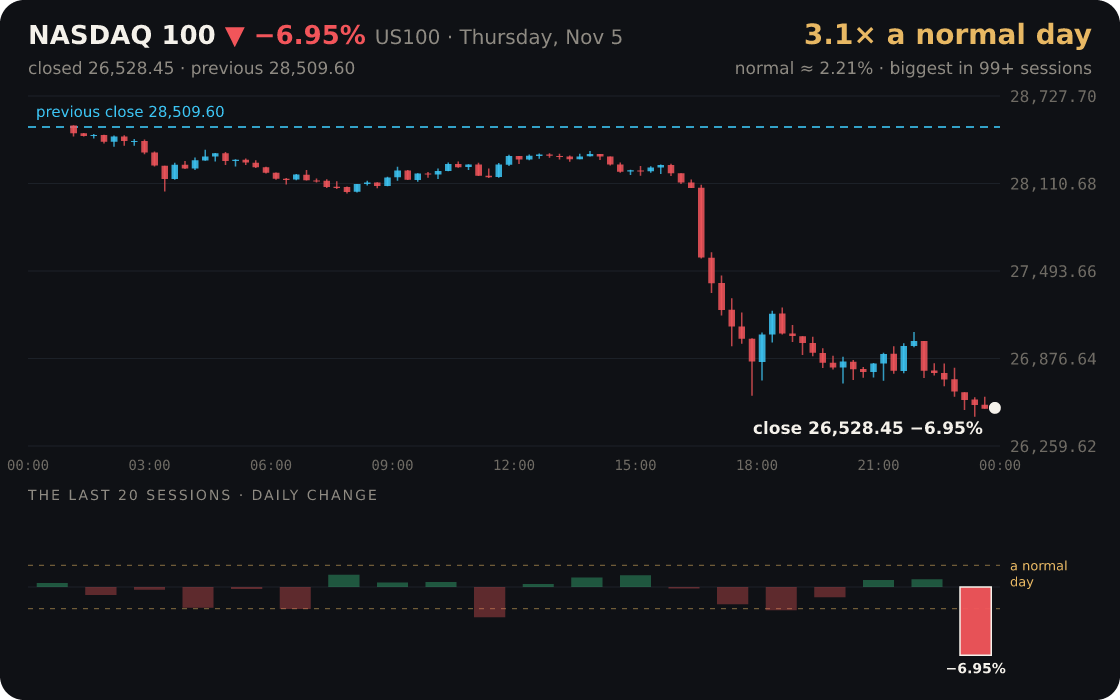
| The move | −6.95% (close to close) |
|---|---|
| A normal day | 2.21% (20-day average range) |
| This day | 3.1× (a normal day) |
Nasdaq 100 fell 6.95% on Thursday, its largest one-day move in at least 99 sessions.
A normal day for Nasdaq 100 is about 2.21%; this one was 3.1× that.
It opened at 28,520.17, traded between 26,465.29 and 28,522.03, and closed at 26,528.45.
4. Dow 30 fell 4.06% — 3.1× a normal day
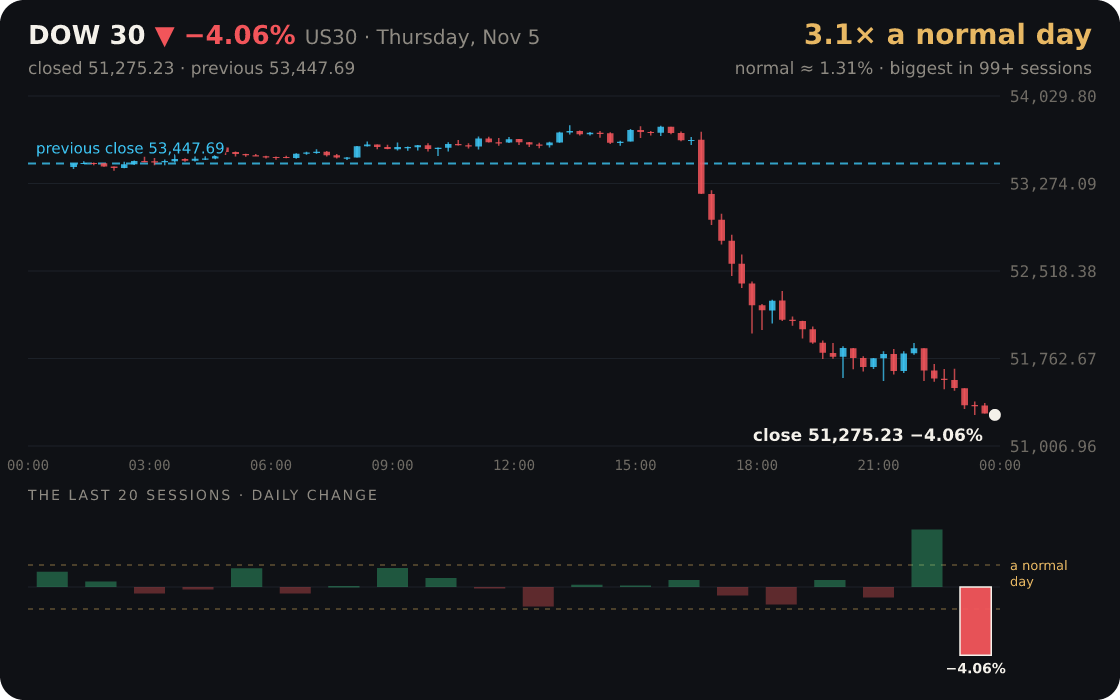
| The move | −4.06% (close to close) |
|---|---|
| A normal day | 1.31% (20-day average range) |
| This day | 3.1× (a normal day) |
Dow 30 fell 4.06% on Thursday, its largest one-day move in at least 99 sessions.
A normal day for Dow 30 is about 1.31%; this one was 3.1× that.
It opened at 53,415.65, traded between 51,258.86 and 53,777.90, and closed at 51,275.23.
5. Ethereum fell 7.80% — 2.1× a normal day
| The move | −7.80% (close to close) |
|---|---|
| A normal day | 3.64% (20-day average range) |
| This day | 2.1× (a normal day) |
Ethereum fell 7.80% on Thursday, its largest one-day move in 78 sessions.
A normal day for Ethereum is about 3.64%; this one was 2.1× that.
It opened at 2,416.72, traded between 2,218.32 and 2,443.68, and closed at 2,228.30.
When the next one comes, trade it with the desk behind you. You take the trade. The desk puts its own capital behind it, steps up as it proves itself, and pays you 90% of what that capital makes.
Trade the next move with the desk behind you →
Prices are from our market data feed; days and times are platform time (New York 17:00 to 17:00). This is market information, not investment advice or a recommendation to trade. Past moves do not predict future ones, and trading involves risk of loss.