

Trade Syndication · New 52-week highs and lows · Tuesday, Oct 6
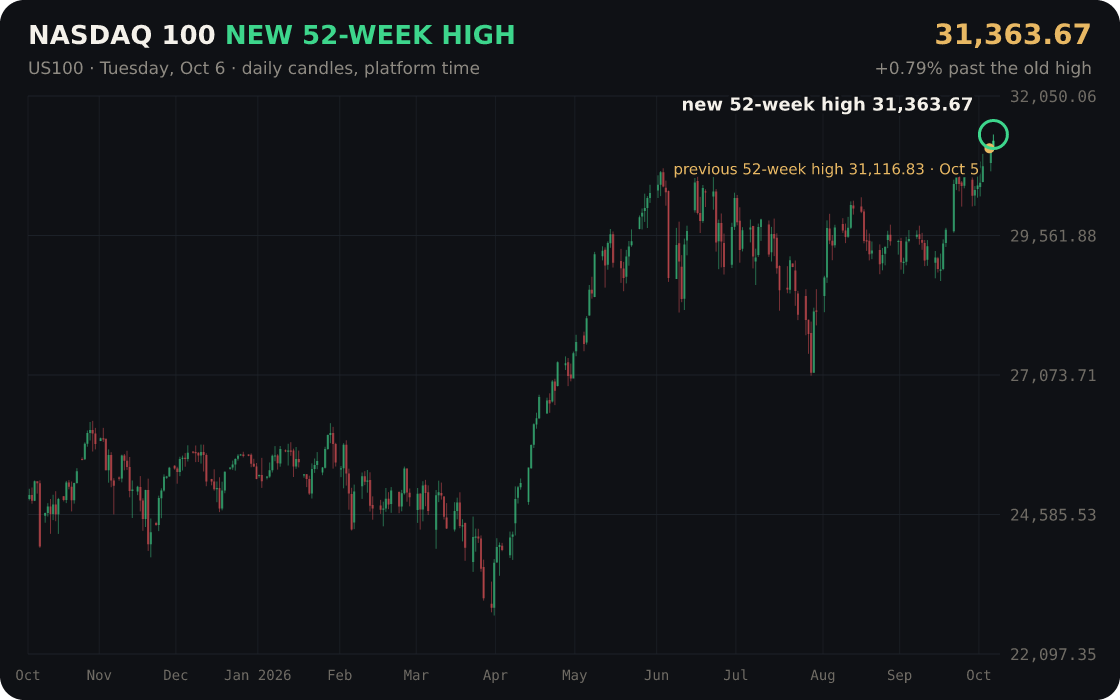
Nasdaq 100 breaks its 52-week high by 0.79%
A year on one chart, with the old high marked.
A new 52-week high (or low) means a market traded above (or below) every price of the previous 365 days. We check every market we cover; these are the ones that broke through on Tuesday, Oct 6.
- ▲ Nasdaq 100 — new 52-week high 31,363.67
- ▲ S&P 500 — new 52-week high 7,844.20
1. Nasdaq 100 hit a new 52-week high at 31,363.67
| New 52-week high | 31,363.67 (Oct 6) |
|---|---|
| Old high | 31,116.83 (Oct 5) |
| Past it by | 0.79% (and closed there) |
On Tuesday Nasdaq 100 traded up to 31,363.67 — above every price of the past year.
That extends a run: the previous 52-week high, 31,116.83, was set only on Oct 5 2026, and it went 0.79% past it.
It closed at 31,250.14, still above the old high (+0.52% on the day).
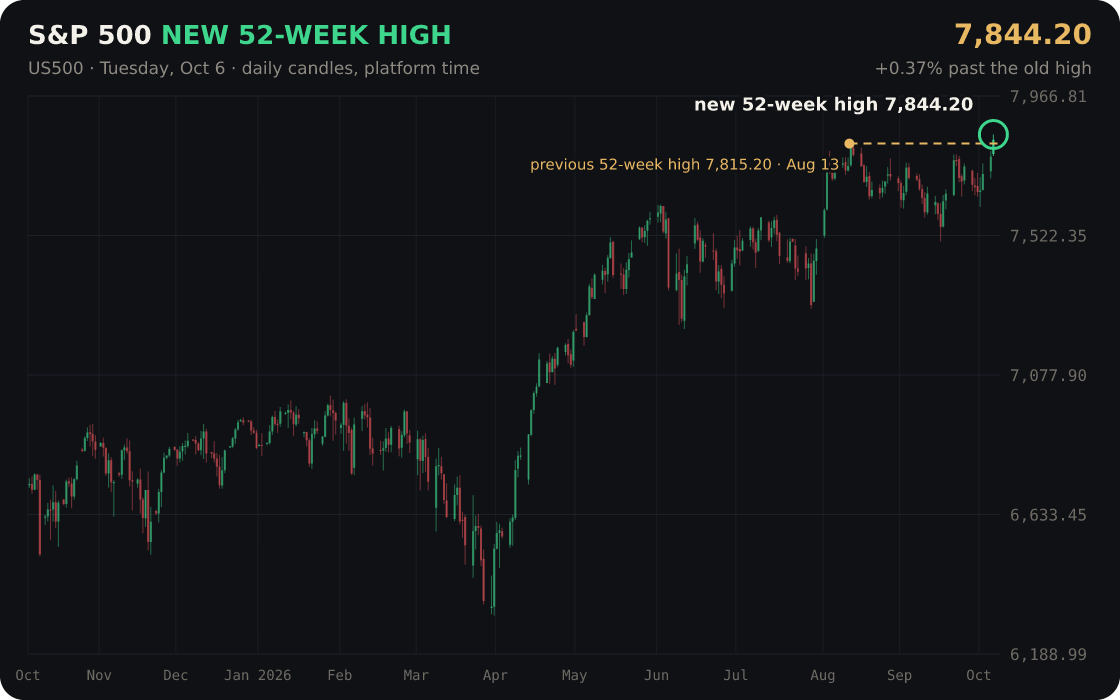
2. S&P 500 hit a new 52-week high at 7,844.20
| New 52-week high | 7,844.20 (Oct 6) |
|---|---|
| Old high | 7,815.20 (Aug 13) |
| Past it by | 0.37% (and closed there) |
On Tuesday S&P 500 traded up to 7,844.20 — above every price of the past year.
The previous 52-week high was 7,815.20, set on Aug 13 2026 (54 days earlier); it cleared it by 0.37%.
It closed at 7,827.50, still above the old high (+0.69% on the day).
When the next breakout comes, trade it with the desk behind you. You take the trade. The desk puts its own capital behind it, steps up as it proves itself, and pays you 90% of what that capital makes.
Trade the next move with the desk behind you →
Prices are from our market data feed; days and times are platform time (New York 17:00 to 17:00). This is market information, not investment advice or a recommendation to trade. Past moves do not predict future ones, and trading involves risk of loss.