
The chart
The chart shows the selected instrument, with range buttons from 1 day to 5 years. When you have a syndicated trade open on the charted instrument, the chart draws the Desk's plan as labelled price lines on the right edge:
| Line | Meaning |
|---|---|
| ◀ ENTRY | Your entry price. |
| ◀ DESK STOP | Where the Desk's stop sits now, with its distance in bp and in dollars. Its colour says what would happen if the price reached it (below). |
| ◀ DESK AVG | The Desk's average entry: a thin light line, shown when it differs from your entry. |
| ◀ N% taken | A level the Desk has already reached. |
| ◀ N% if it reaches here / ◀ NEXT RUNG | The price at which the Desk can add to its allocation next. |
| ◀ desk down to N% / ◀ desk fully out here | Where the Desk would scale back, or leave the trade. |
| ◀ trailing starts here | The price from which the Desk stop starts to trail. |
With no trade open, faint lines show where the Desk would add if you opened a trade now. When a market is closed (at the weekend, for example), the chart opens on its last session. If the chart does not load, reloading the page usually fixes it.
The colour of the Desk stop
The same colours are used on the chart, in Backtest Allocation and in every replay. They describe the stop, not the trade: what you and the Desk would be left with if the price reached the stop now.
| Colour | If the price reached the stop |
|---|---|
| Red | The stop is still at or close to where it started: the trade would close at about its full opening risk. |
| Light red | The stop has moved in your favour, but the trade would still close at a loss. |
| Amber | About break-even. Also amber: a stop past your entry where the Desk's own allocation would not be in profit, because it bought later than you. |
| Green | Both your position and the Desk's allocation would be in profit, including anything the Desk has already banked. |
| Violet | Your profit appetite is holding the stop to protect earnings (Chapter 4). |
Backtest Allocation
The Backtest Allocation button replays real past prices to show exactly what the Desk would have done on a trade you pick, and what you would have earned.

- Press 1 · Click your entry and click the chart where you would have opened. You can type a price or tap O, H, L or C to use that minute's open, high, low or close.
- Press 2 · Click your close and click where you would have closed. Leave it unset and the replay runs to the end of the chart.
- Choose BUY or SELL and the number of contracts, then press Calculate Syndication.
The result shows every increase the Desk made, its trailing stop, its own exit and what you would have been paid, with a player to step through the minutes: Step by step plays them one by one, and ‹ Desk and Desk › jump between the Desk's actions. If the Desk would not have joined, it says so and why. The window uses your current Timeframe setting.
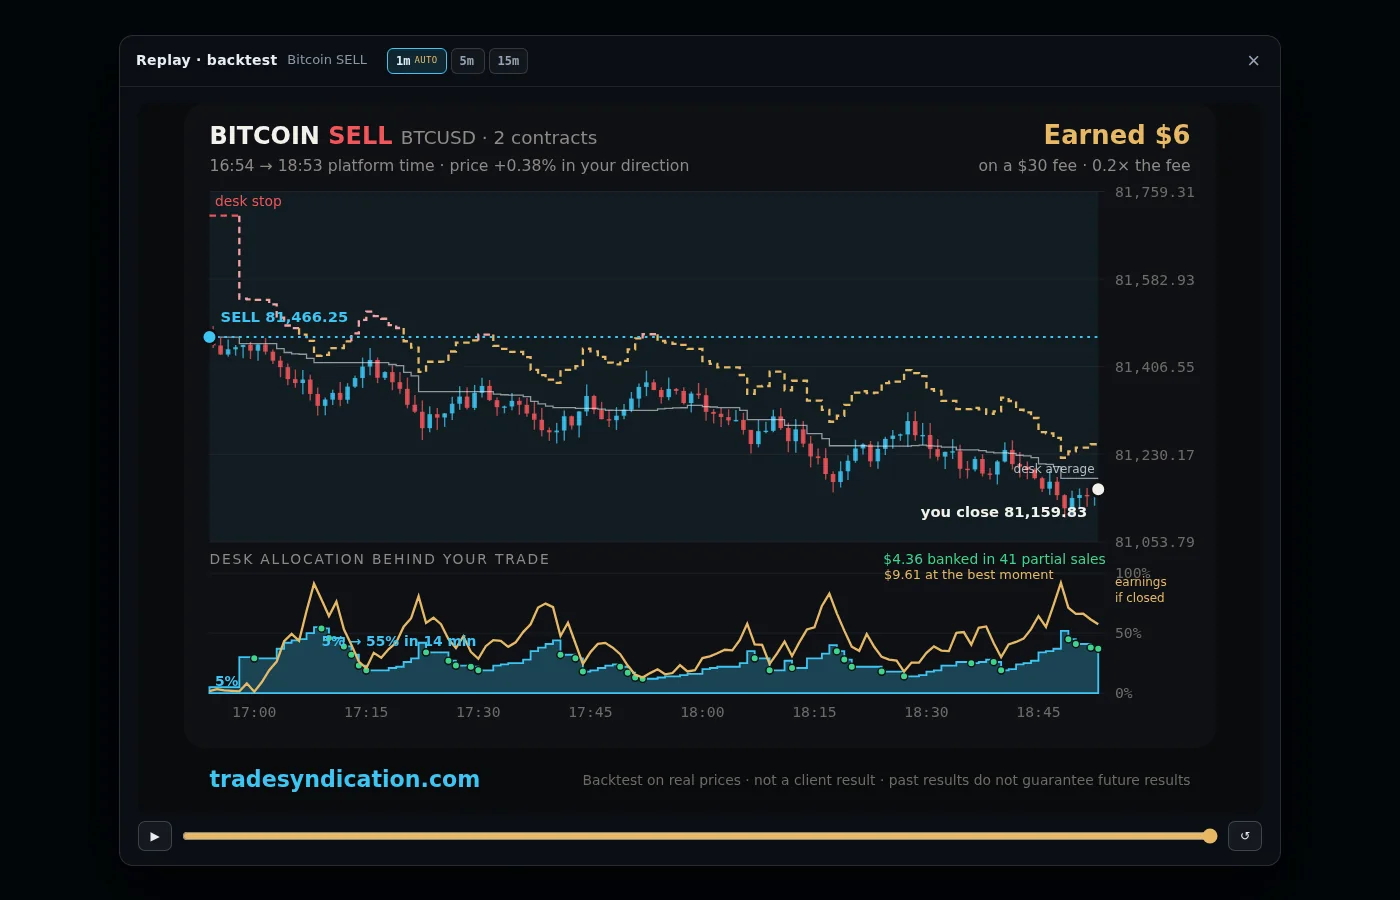
Press ▶ Watch the replay under the result to see the backtest as a replay: the same picture a closed trade gets (Chapter 15), with the Desk's allocation underneath, its stop in colour, its average entry, and the candle size of your choice.