

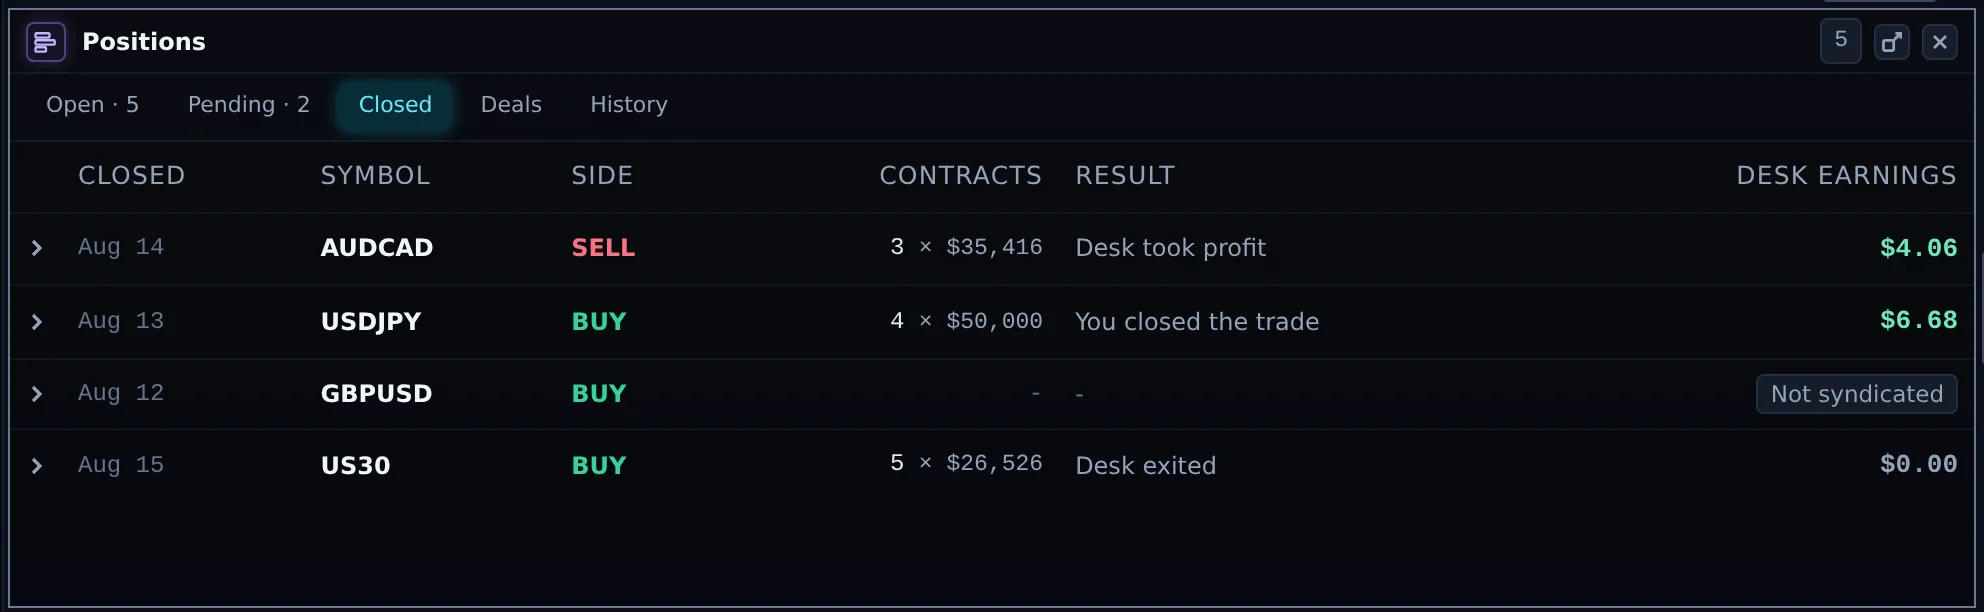
The Closed tab lists finished trades with the close date, symbol, side, contracts, the Result (Chapter 10) and your Desk earnings. Open a row for the underlying trade's lots, open and close prices and times, commission, swap and underlying P&L, and for these buttons:
- ▶ Replay (syndicated trades): an animated replay of the trade.
- Share: make a share card or link.
- View full details: the trade summary, your earnings, the peak allocation and the result.
Watching an open trade live
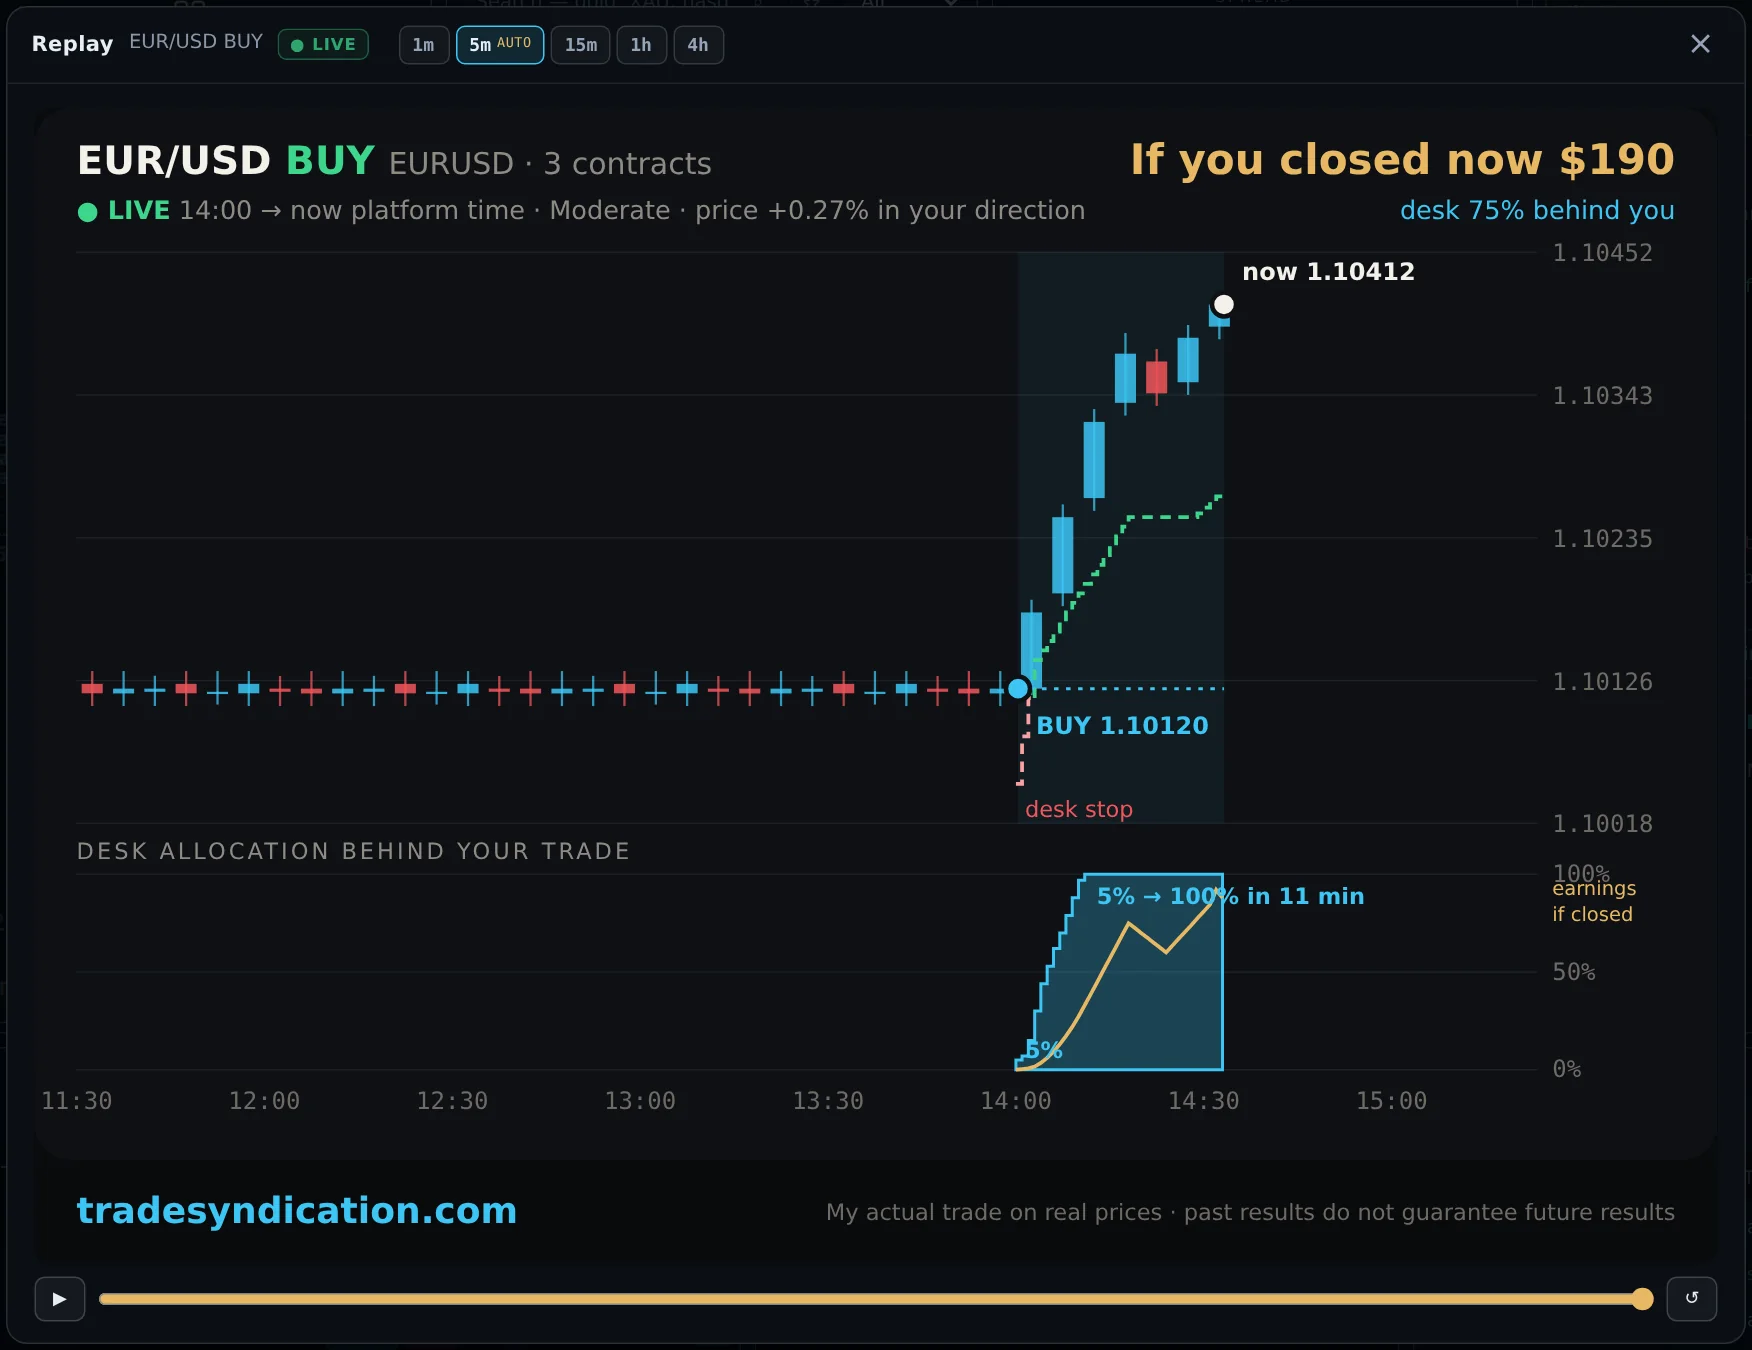
The replay also works on an open trade. Press ▶ in the Watch column of the Open tab: the replay plays the trade from its entry up to now, marked ● LIVE, and then stays live. The last candle moves with the price, and the header keeps showing what you would get if you closed now and how much of your size the Desk holds. The picture refreshes every minute; when the trade closes, the window turns into the normal replay of the closed trade. Share is offered once the trade has closed.
Replay of a closed trade
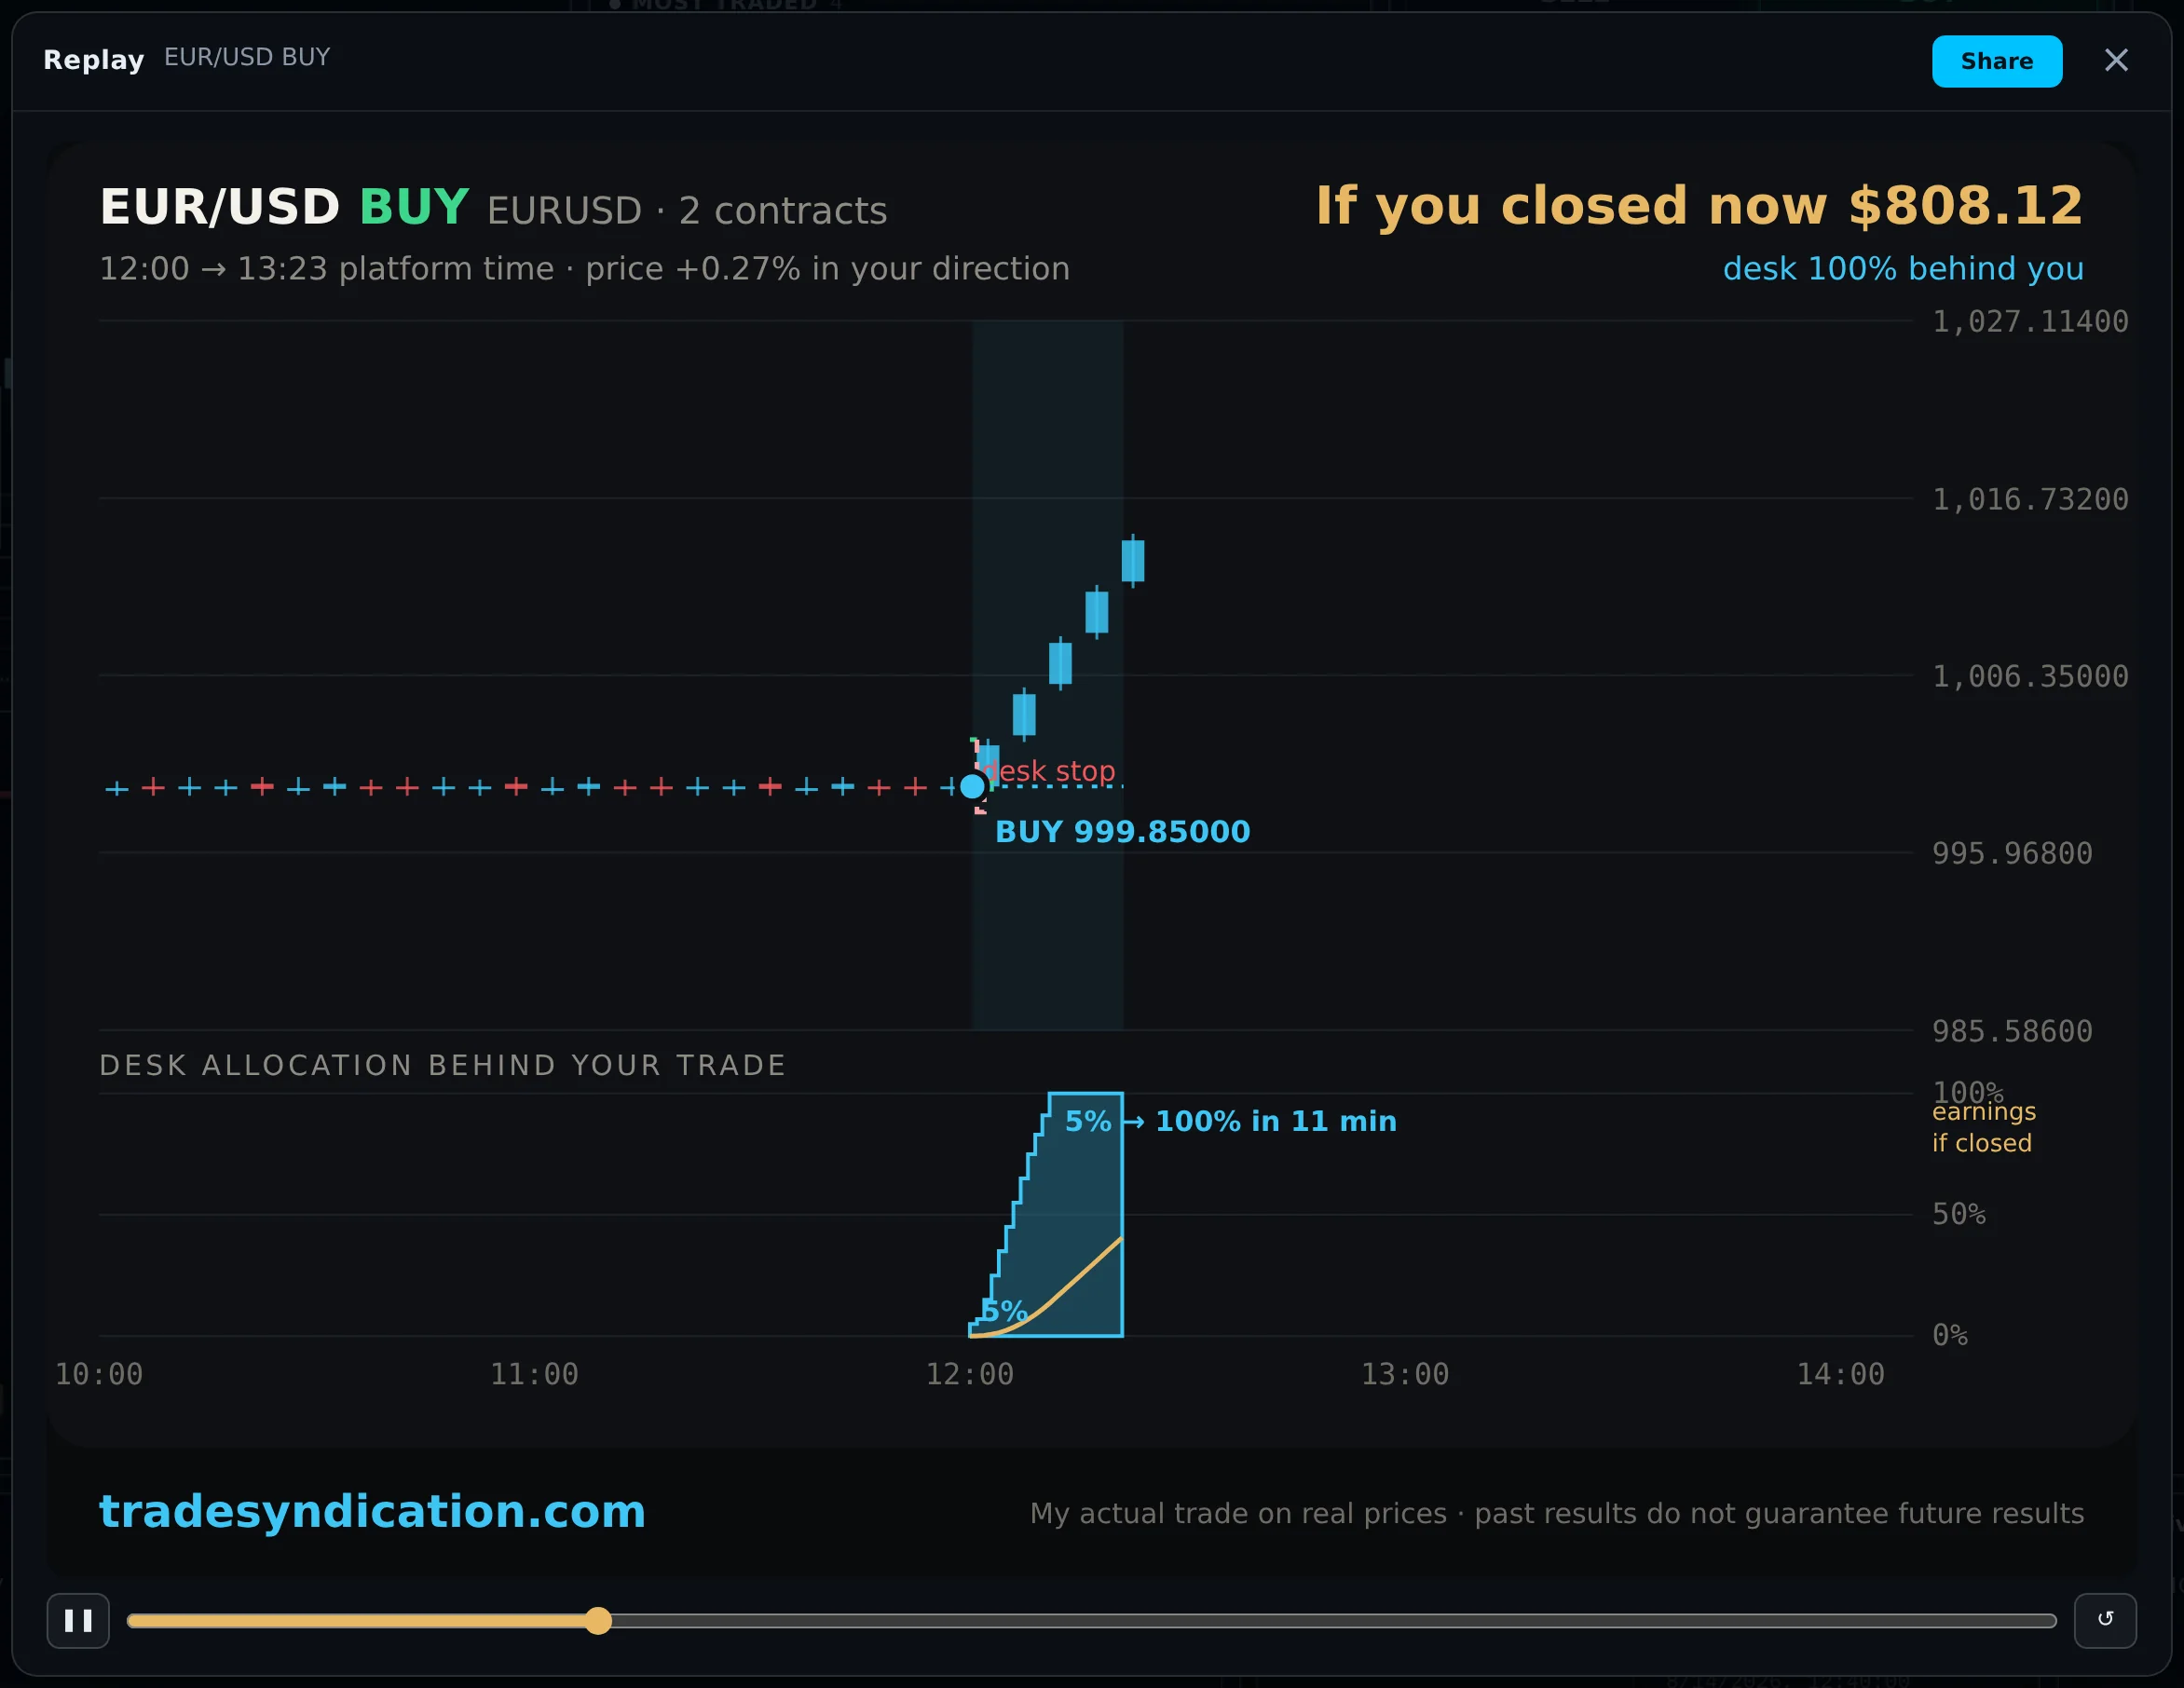
The replay plays your trade candle by candle, with your entry, the Desk stop and, underneath, the Desk allocation behind your trade growing over time, with your earnings line. The headline shows what you would have earned if you had closed at that moment, and how much of your size the Desk was holding. Where the Desk sold part of its allocation on a pullback, a dot marks each step down, green when the sales so far had banked a gain and red when they had banked a loss, and the total banked is shown above the allocation. A thin light line shows the Desk's average entry while it is in the trade, and the Desk stop is drawn in the colours described in Chapter 6.
Choose the candle size (one is picked automatically for the trade's length), play or pause, drag the bar, or restart. Share creates a link to the replay.
Sharing a trade
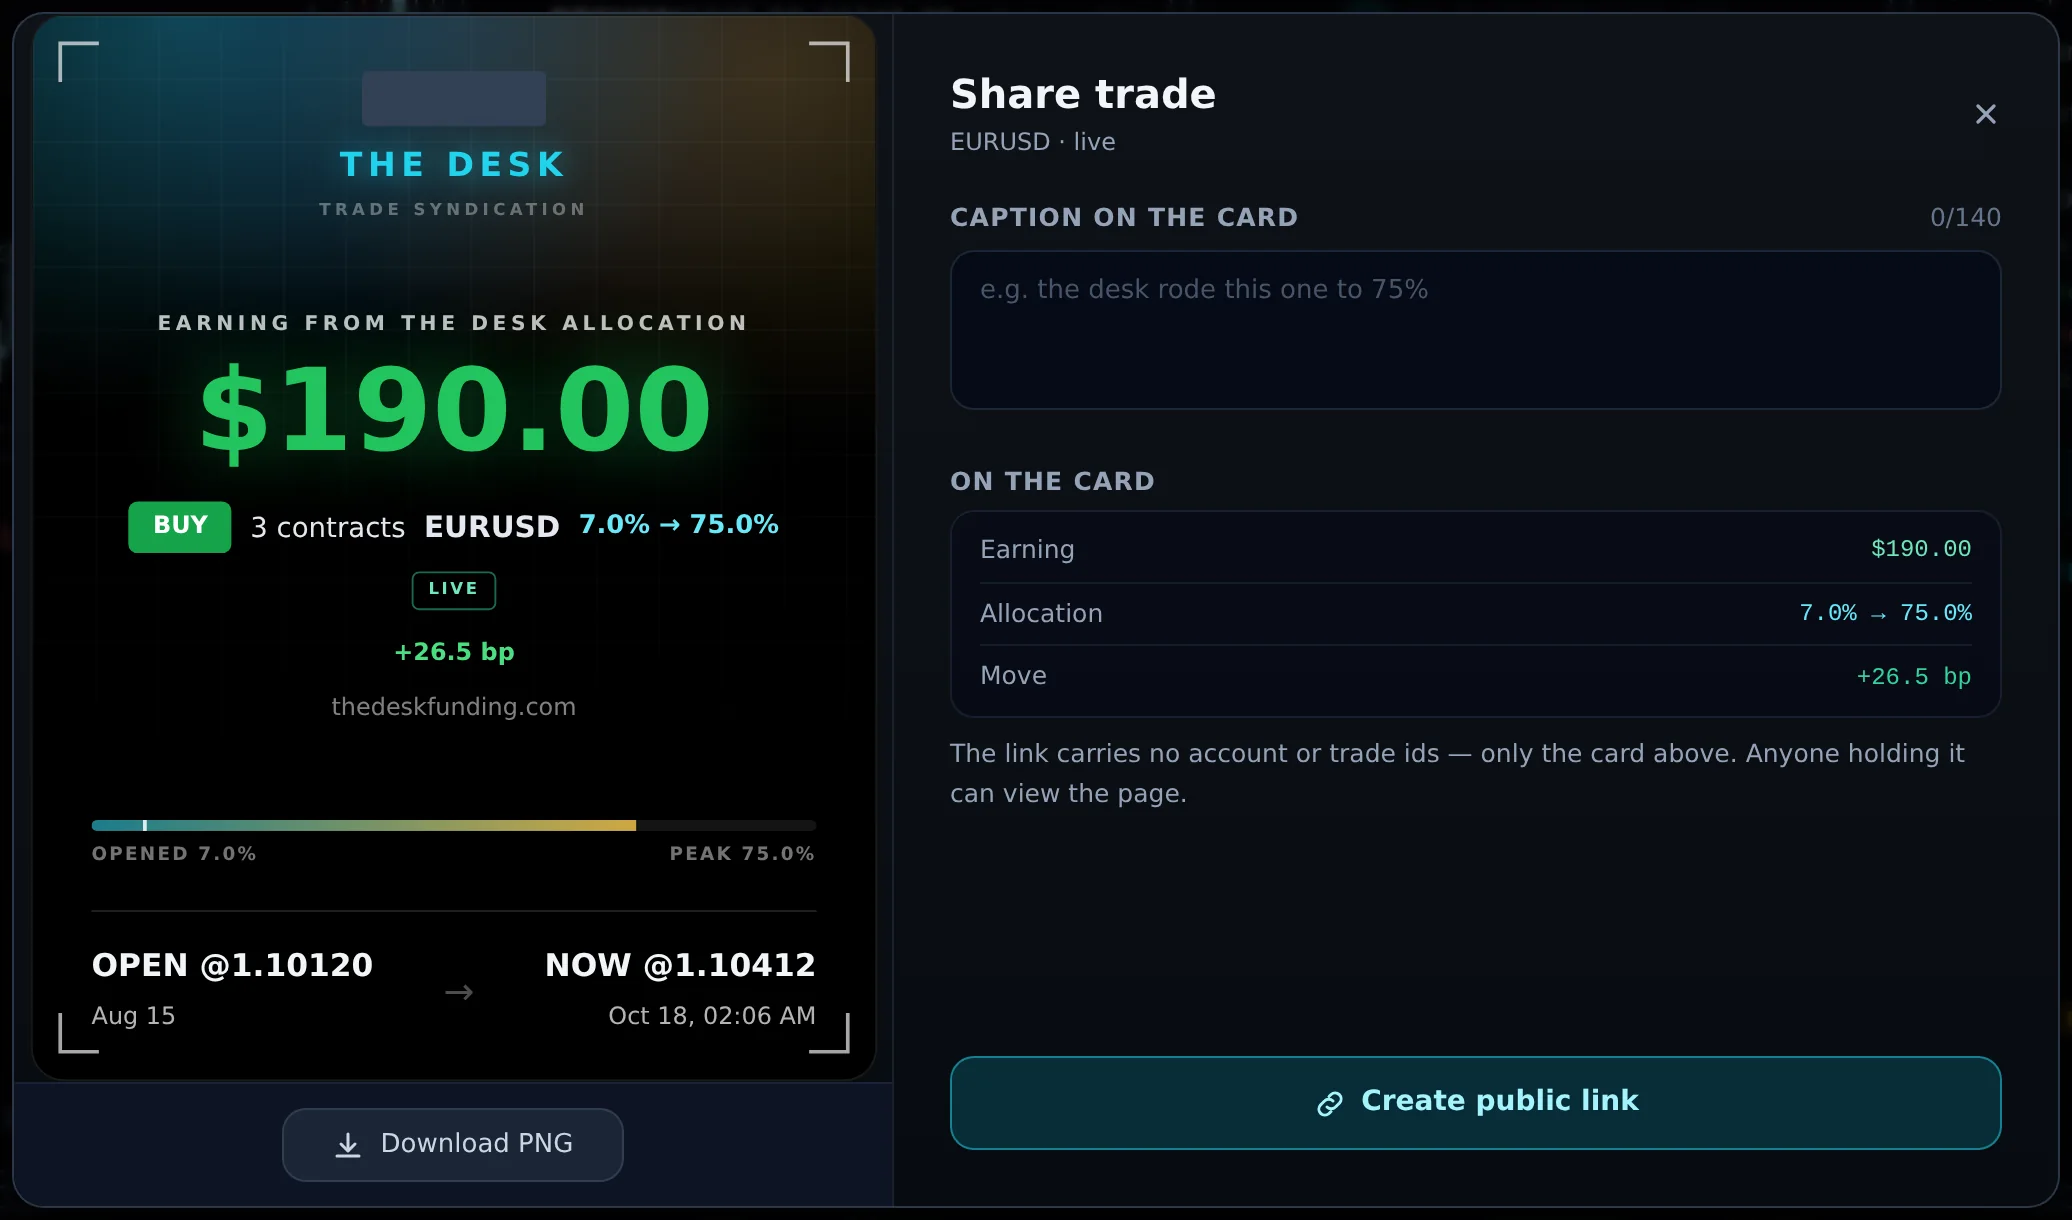
The share card shows what you earned (or are earning) from the Desk allocation, the instrument, side and size, the allocation from where it opened to its peak, the move, and the open and close (or current) prices. Add an optional caption, then Download PNG or Create public link.
- The link carries no account or trade numbers, only the card. Anyone holding the link can view the page.
- When sharing a replay you can stay Anonymous (the page says "a Trade Syndication trader") or Signed (your first name, last initial and the month you started with the Desk), and add a note.
- Your shared trades, with their views and sign-ups, are listed under My shared trades.