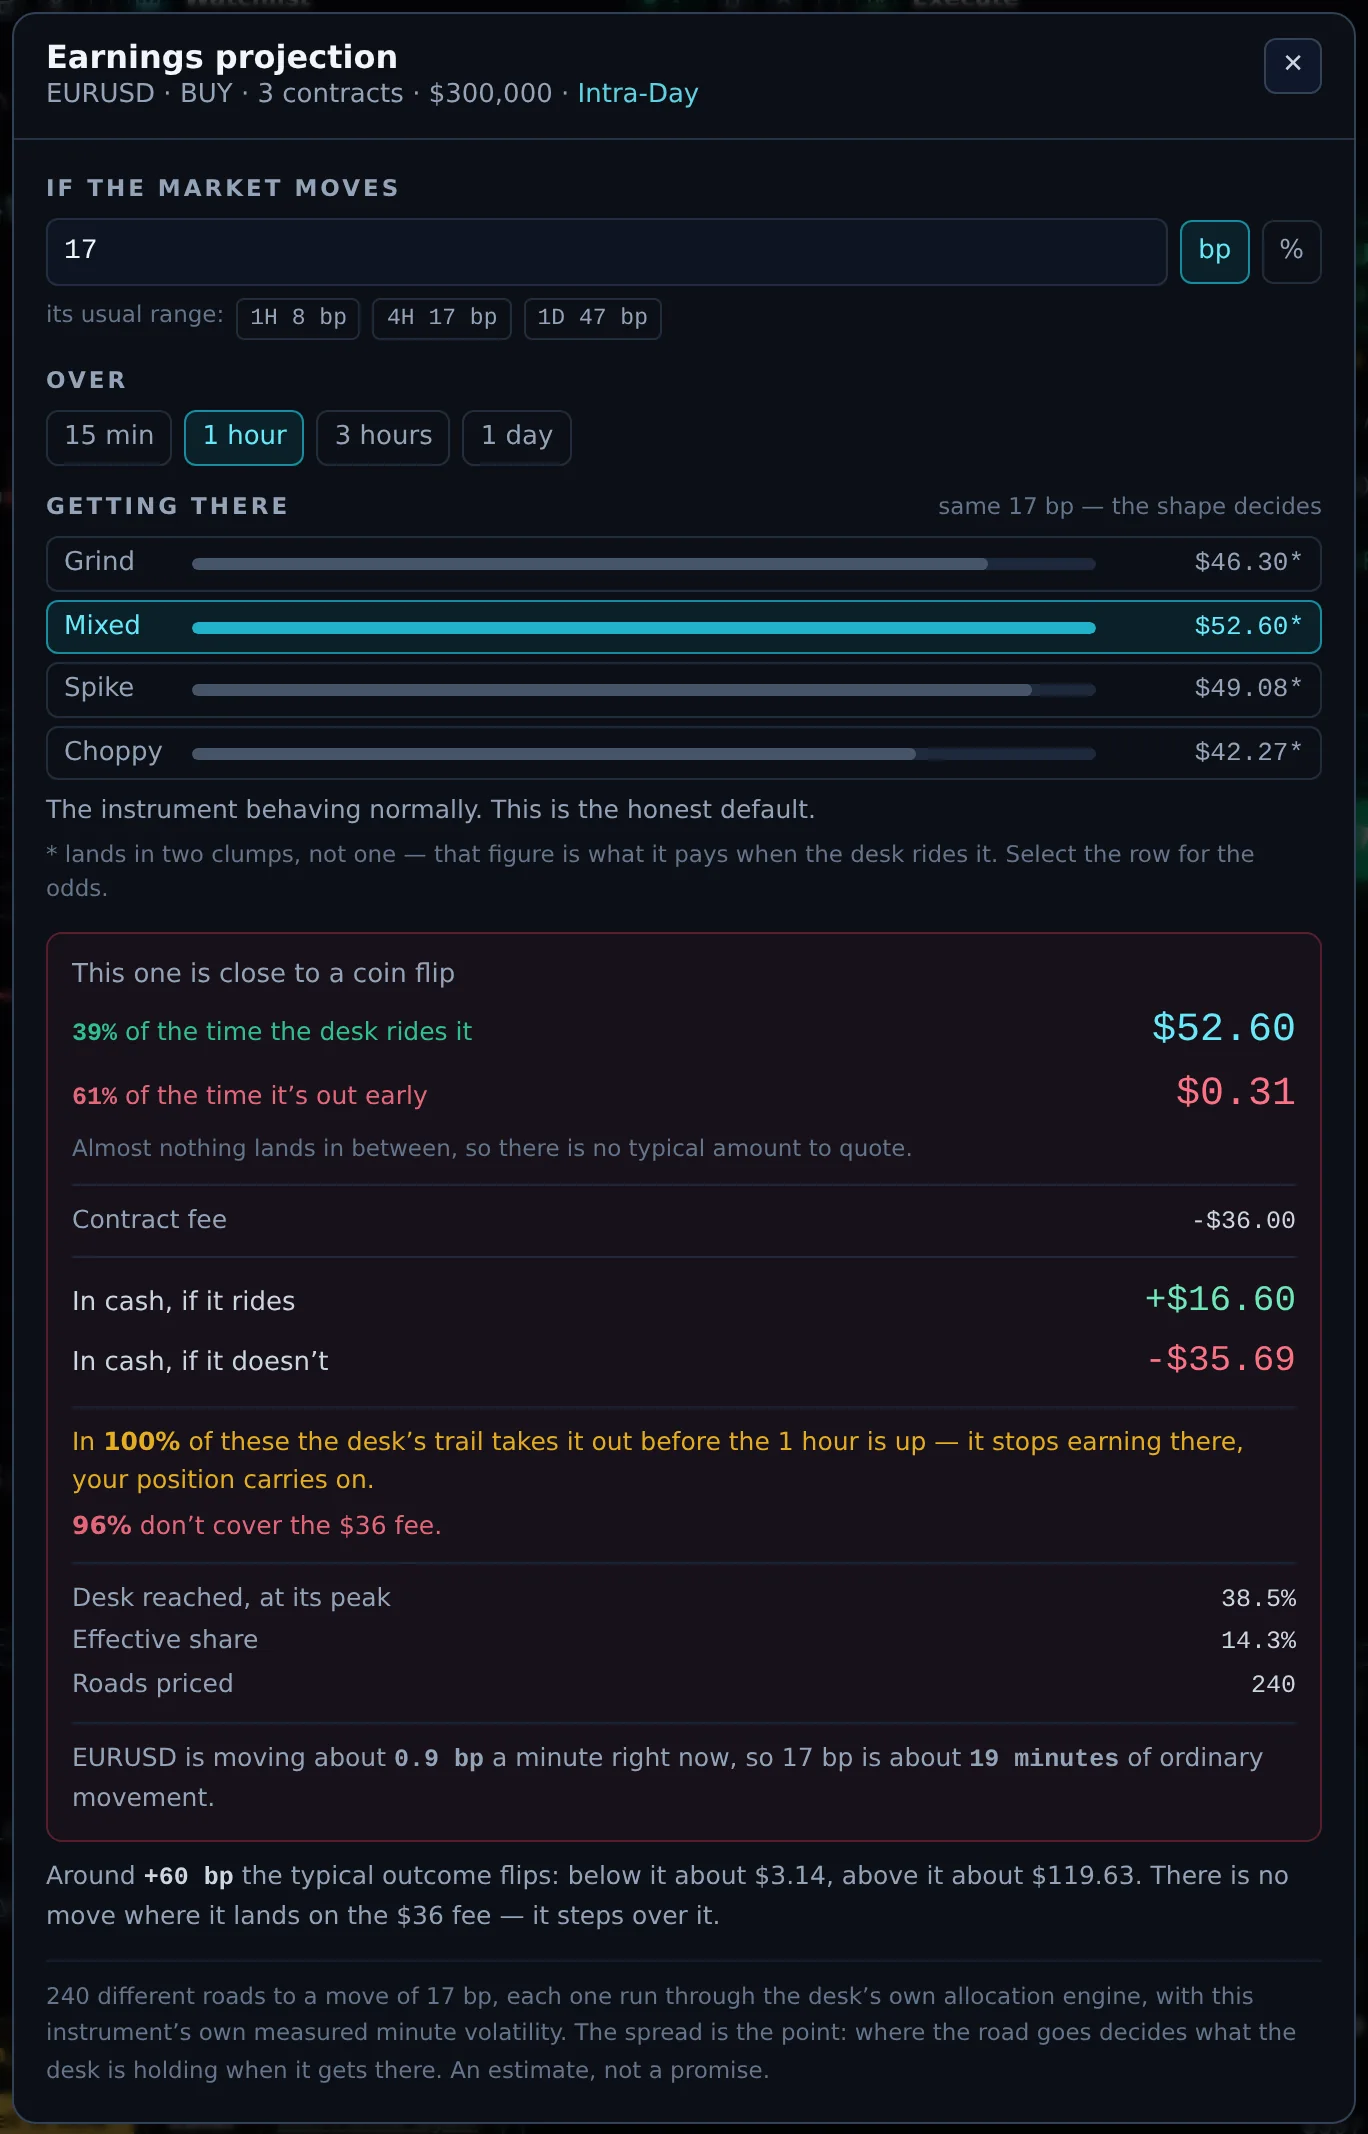

The projection answers one question: if the market moves this much, over this long, what would the allocation pay me? It runs thousands of possible price paths through the Desk's own allocation and reports the typical result.
Inputs
- If the market moves: a move in bp or %. Shortcut buttons fill in the instrument's usual 1-hour, 4-hour and 1-day range.
- Over: 15 minutes, 1 hour, 3 hours or 1 day.
- Getting there: the same move can arrive in different shapes, and the shape changes what the Desk does:
- Grind: an unusually clean, one-way trend.
- Mixed: the instrument behaving normally. The honest default.
- Spike: most of the move in the first few minutes.
- Choppy: much noisier than usual.
Results
- The allocation typically pays: the middle outcome, with the range that half the outcomes fall in.
- When outcomes split into two groups, it shows both ("of the time the Desk rides it" and "it's out early"), because an average would describe neither.
- The contract fee and any overnight carry, and what is left in cash.
- How the Desk would build the position: each level, the Desk's holding and the move needed. These are ceilings, not a schedule: the Desk steps up gradually and only while its own risk allows.
- Three roads to the same move: a typical road, a road where the Desk scales back and adds again, and a road where it pays nothing.
- Break-even: about how far the price needs to move for a typical outcome to cover the fee.
The projection is an estimate, not a promise. It shows how the Desk behaves across many paths; any single trade can do better or worse.